bluebell
- bluebell.MVBE(x, tol=0.001, maxiter=1000)[source]
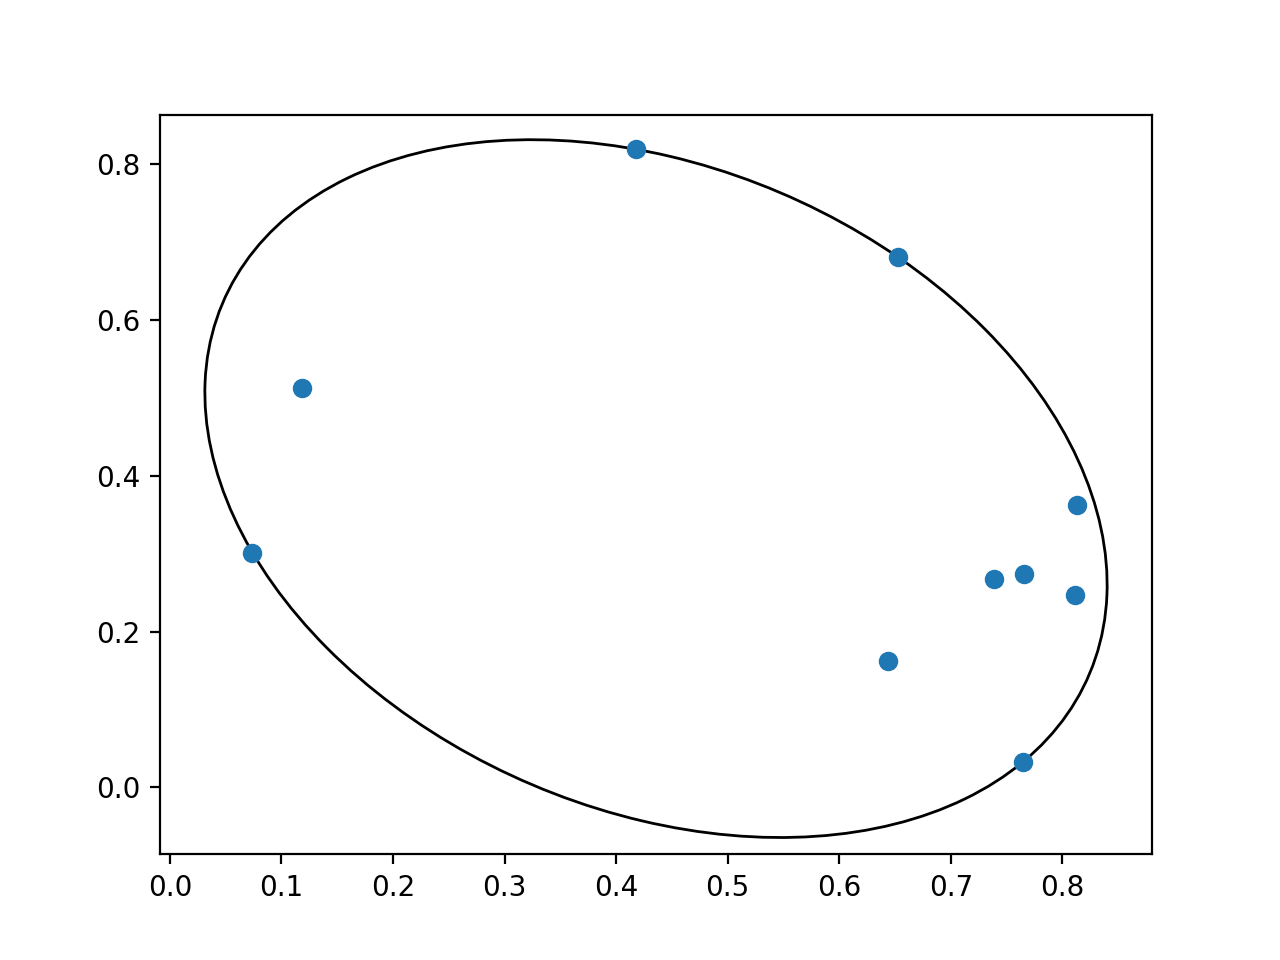
Return the mean and covariance matrix that define the minimum-volume ellipsoid that bounds the points in
xusing algorithm 3.2 of Moshtagh (2005).- Parameters:
x (2-d NumPy array of shape (N, D)) –
tol (float, optional) – Tolerance parameter for precision of bounding ellipsoid (default=1e-3).
maxiter (int, optional) – Maximum number of iterations to perform (default=1000).
- Returns:
mu (1-d NumPy array of shape (D,)) – Mean (or center) of the ellipsoid.
C (2-d NumPy array of shape (D,D)) – Covariance matrix that defines the ellipsoid.
Example
import matplotlib.pyplot as pl
import bluebell as bb
import bluebell.plot as bbplot

x = np.random.rand(10,2)
mu, C = bb.MVBE(x)

pl.plot(*x.T, 'o')
bbplot.cov_ellipse(mu, C, fc='none', ec='k')
(
Source code,png,hires.png,pdf)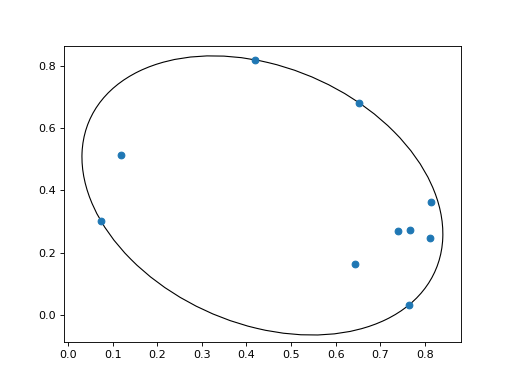
- bluebell.select_by_relative_chi2(chi2, sigma_inner=1e-07, sigma_outer=inf)[source]
Returns a logical array that is
Truewherechi2relative to its minimum is within the range defined bysigma_innerandsigma_outer. i.e. wheresigma_inner**2 < chi2-np.min(chi2) < sigma_outer**2.
- bluebell.estimate(x, chi2, sigma_inner=1e-07, sigma_outer=inf, tol=0.001, maxiter=1000)[source]
Estimate uncertainties for a sample of points given their correspond values of chi-squared.
- Parameters:
x (2-d NumPy array of shape (N, D)) – Points at which chi-squared has been evaluated.
chi2 (1-d NumPy array of shape (N,)) – Values of chi-squared for the points in
x.sigma_inner (float, optional) – Only use the points that are more than this many sigma from the minimum.
sigma_outer (float, optional) – Only use the points that are less than this many sigma from the minimum.
tol (float, optional) – Tolerance parameter for finding minimum-volume bounding ellipsoid.
maxiter (int, optional) – Maximum number of iterations to use when finding minimum-volume bounding ellipsoid.
- Returns:
mu (1-d NumPy array of shape (D,)) – Mean (or center) of the minimum-volume bounding ellipsoid around the rescaled points in
x.C (2-d NumPy array of shape (D,D)) – Covariance matrix that defines the ellipsoid.
- bluebell.propagate(x, y, mu, C, weights=None)[source]
Propagate the uncertainties on
xto other dependent variablesy. Returns full mean and uncertainty so that the correlations between main parameters and dependent variables are given.- Parameters:
x (2-d NumPy array) – Points at which function has been evaluated.
y (2-d NumPy array) – Values of function at points in
x.mu (1-d NumPy array of shape (D,)) – Mean (or center) of the ellipsoid that characterizes the
chi2values of the points inx.C (2-d NumPy array of shape (D,D)) – Covariance matrix of the ellipsoid.
weights (1-d NumPy array, optional) – Relative weights for the points in the fit.
- Returns:
mu (1-d NumPy array of shape (D,)) – Mean (or center) of both the underlying parameters
xand the dependent variablesy.C (2-d NumPy array of shape (D,D)) – Covariance matrix of both the underlying parameters
xand the dependent variablesy.
- bluebell.linearize(x, y, weights=None)[source]
Given a set of points
xand the valuesyof some (vector) function evaluated at those points, find the parameters of the best-fitting affine map betweenxandy. i.e. returns arraysQandBsuch thaty == Q + x.dot(B.T).- Parameters:
x (2-d NumPy array of shape (N, D)) – Points at which function has been evaluated.
y (2-d NumPy array of shape (N, K)) – Values of function at points in
x.weights (1-d NumPy array, optional) – Relative weights for the points in the fit.
- Returns:
Q (1-d NumPy array of shape (K,)) – Constant offset of affine map from
xtoy.B (2-d NumPy array of shape (K, D)) – Matrix transformation of affine map from
xtoy.
- bluebell.linear_optimum(x, y, obs, err, weights=None, rcond=None)[source]
Given a set of points
x, the valuesyof some (vector) function evaluated at those points, observed values of the functionobsand uncertainties on those observationserr, finds the best-fitting parameters an affine model ofyas a function ofx.- Parameters:
x (2-d NumPy array of shape (N, D)) – Points at which function has been evaluated.
y (2-d NumPy array of shape (N, K)) – Values of function at points in
x.obs (1-d NumPy array of shape (D,)) – Observed values.
err (1-d NumPy array of shape (D,)) – Uncertainties on observed values.
weights (1-d NumPy array, optional) – Relative weights for the points in the fit.
rcond (float) –
rcondparameter passed tonumpy.linalg.lstsq.
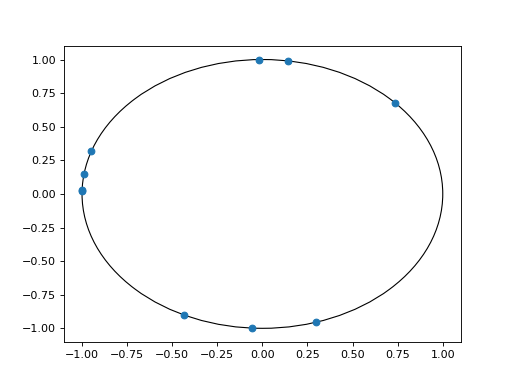
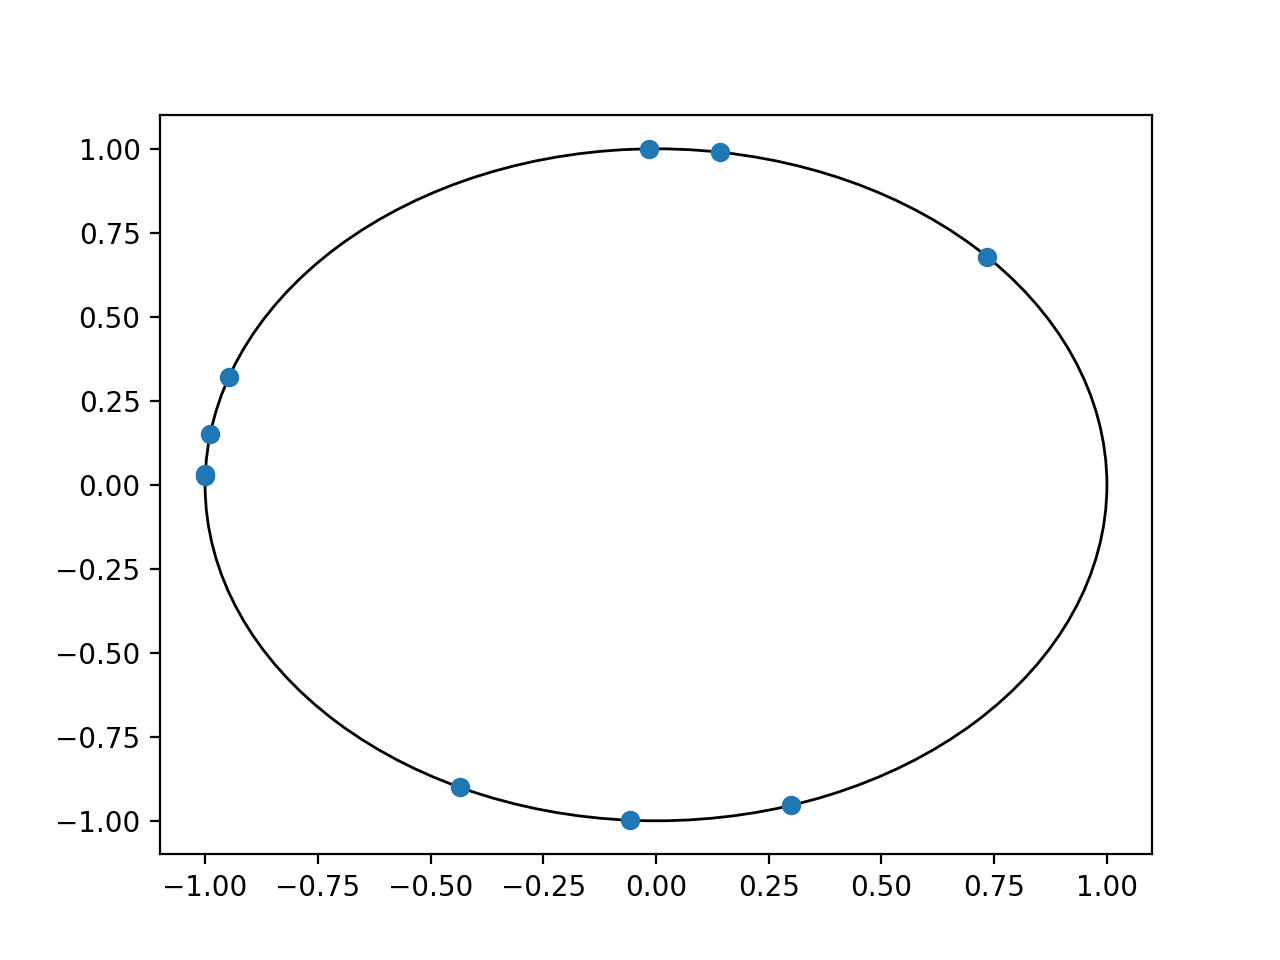
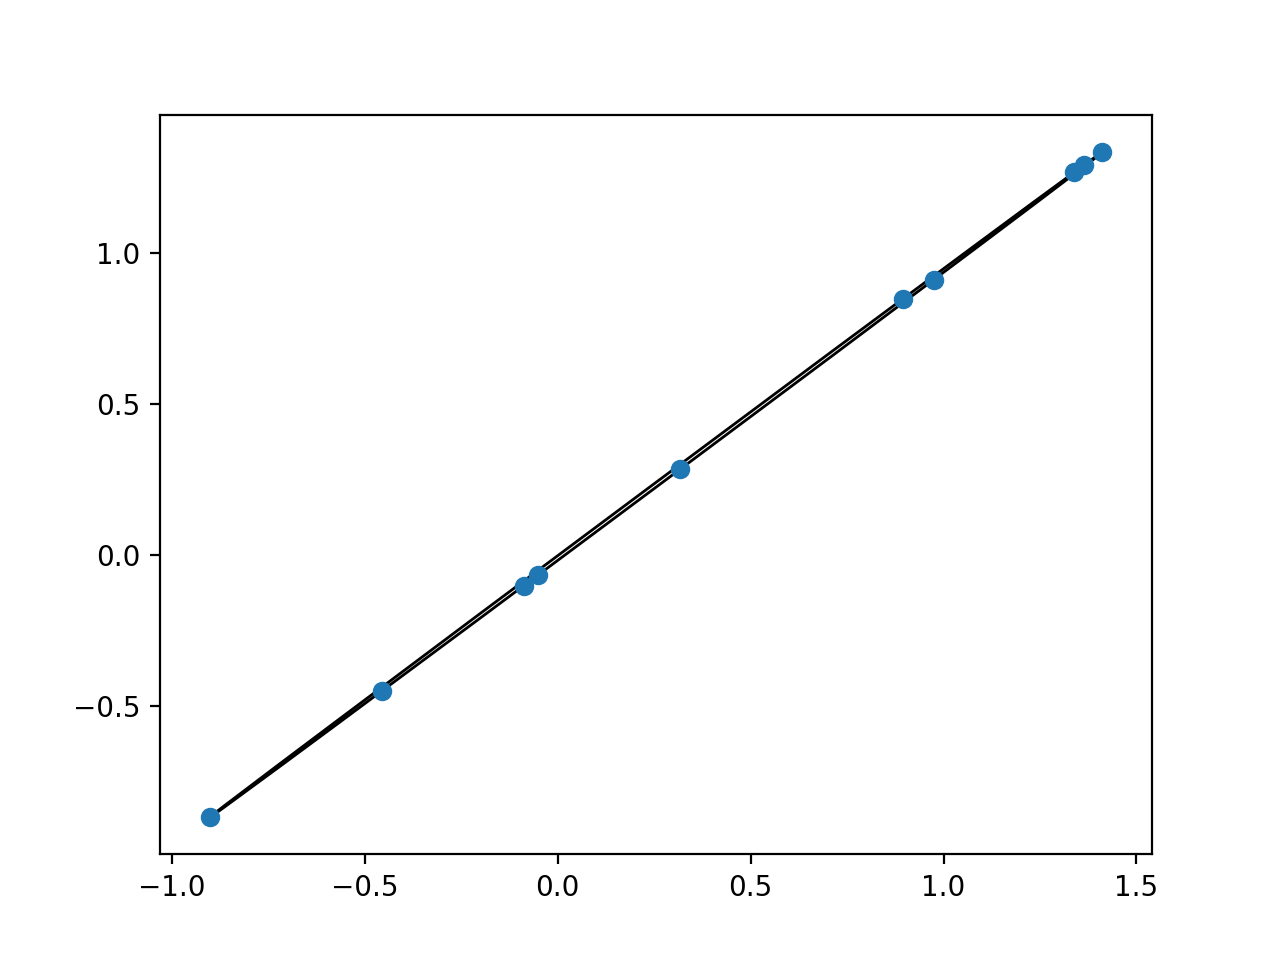
- bluebell.uniform_on_unit_sphere(N, D)[source]
Draw
Npoints uniformly distributed on the surface of aD-dimensional unit sphere.Example
import matplotlib.pyplot as pl
import bluebell as bb
import bluebell.plot as bbplot

x = bb.uniform_on_unit_sphere(10, 2)
pl.plot(*x.T, 'o')
bbplot.cov_ellipse(np.zeros(2), np.eye(2), fc='none', ec='k')
(
Source code,png,hires.png,pdf)
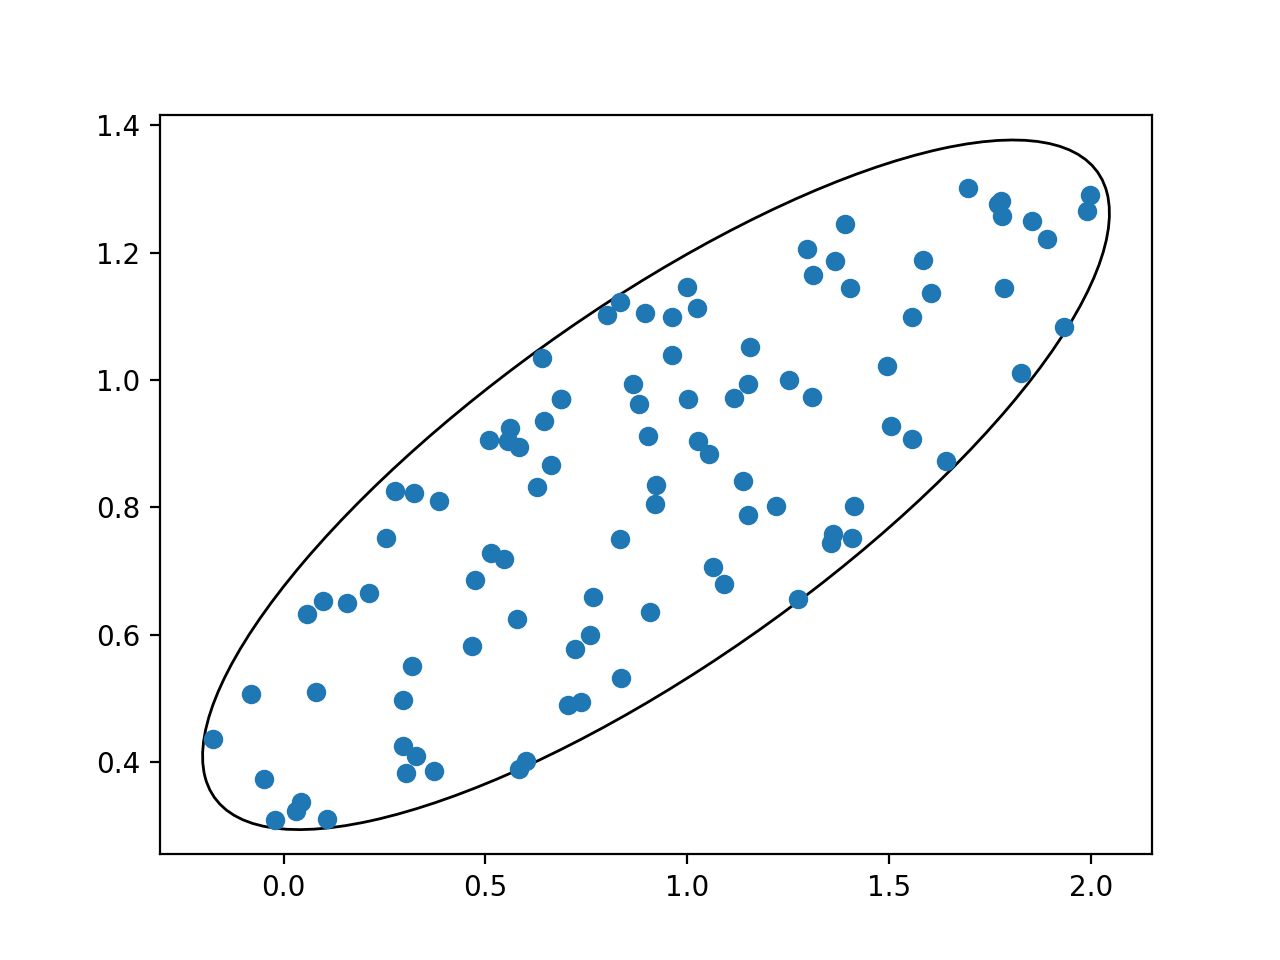
- bluebell.uniform_on_ellipsoid(mu, C, N)[source]
Draw
Npoints uniformly distributed on the surface of the ellipsoid define by meanmuand covarianceC.Example
import matplotlib.pyplot as pl
import bluebell as bb
import bluebell.plot as bbplot

mu = np.random.rand(2)
A = np.random.rand(2,2)
C = A.T.dot(A)
x = bb.uniform_on_ellipsoid(mu, C, 10)
pl.plot(*x.T, 'o')
bbplot.cov_ellipse(mu, C, fc='none', ec='k')
(
Source code,png,hires.png,pdf)
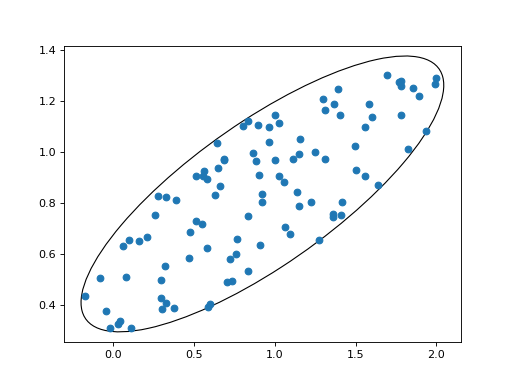
- bluebell.uniform_in_ellipsoid(mu, C, N)[source]
Draw
Npoints uniformly distributed inside the ellipsoid define by meanmuand covarianceC.Example
import matplotlib.pyplot as pl
import bluebell as bb
import bluebell.plot as bbplot

mu = np.random.rand(2)
A = np.random.rand(2,2)
C = A.T.dot(A)
x = bb.uniform_in_ellipsoid(mu, C, 100)
pl.plot(*x.T, 'o')
bbplot.cov_ellipse(mu, C, fc='none', ec='k')
(
Source code,png,hires.png,pdf)
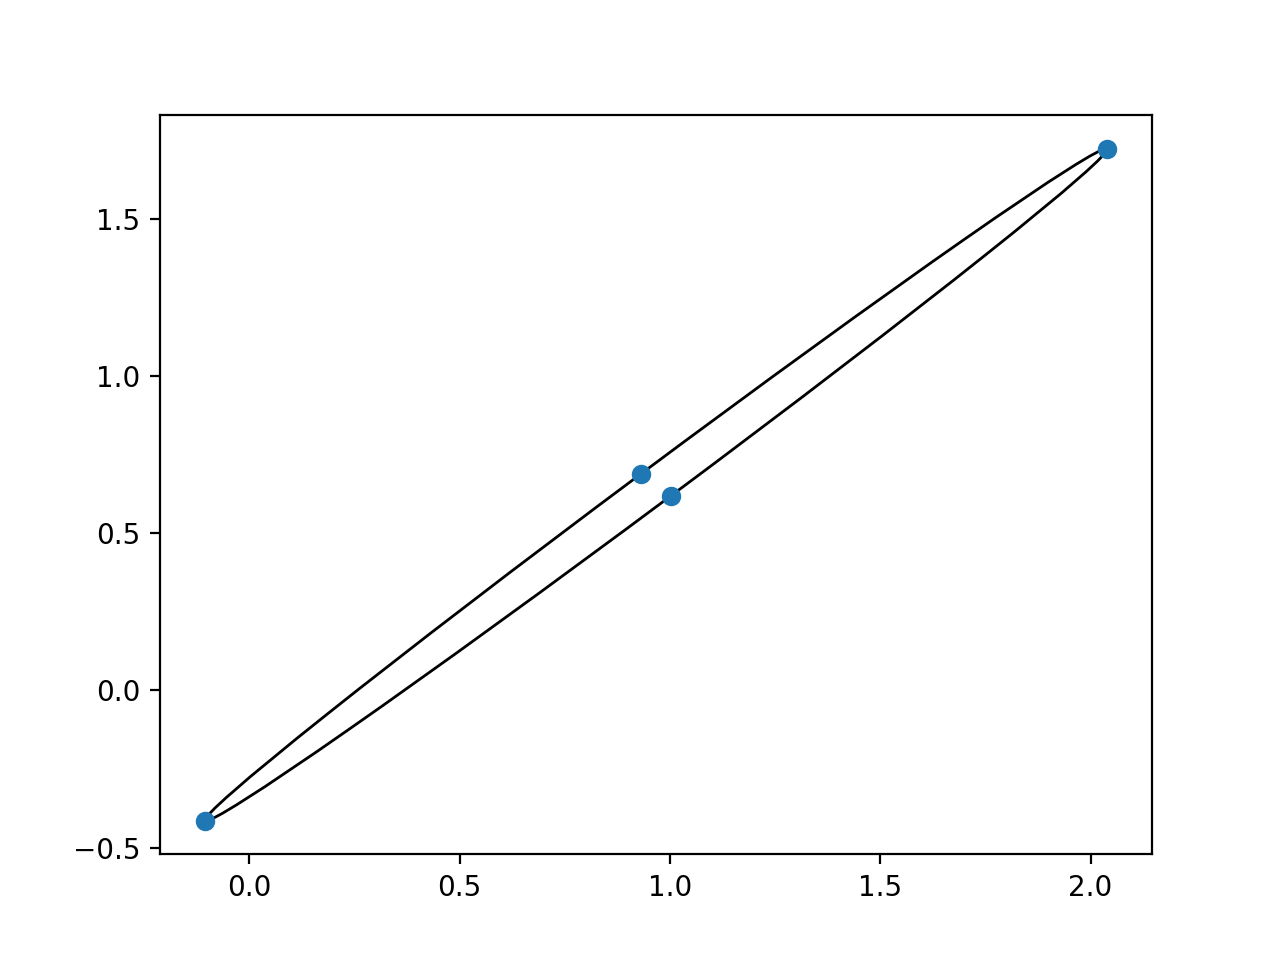
- bluebell.vertices(mu, C)[source]
Return the
2*Dpoints at the ends of each axis of the ellipsoid defined by meanmuand covarianceC.Example
import matplotlib.pyplot as pl
import bluebell as bb
import bluebell.plot as bbplot

mu = np.random.rand(2)
A = np.random.rand(2,2)
C = A.T.dot(A)
x = bb.vertices(mu, C)
pl.plot(*x.T, 'o')
bbplot.cov_ellipse(mu, C, fc='none', ec='k')
(
Source code,png,hires.png,pdf)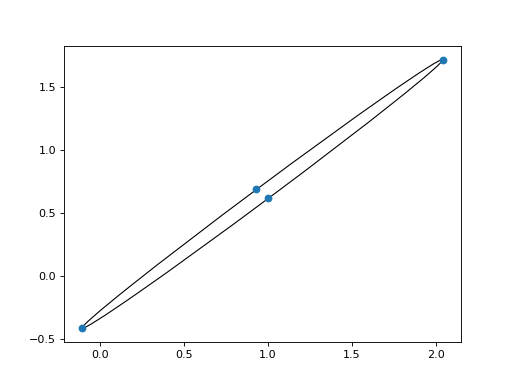
- bluebell.is_in_ellipsoid(x, mu, C)[source]
Returns
Trueif the point(s) inxare inside the ellipsoid defined by meanmuand covarianceC.
- bluebell.is_in_simplex(x, s)[source]
Returns
Trueif the 1-d arrayxis in the simplexs, wheresis a 2-d array with dimensions(D+1,D)(each row is a point).