bluebell.plot
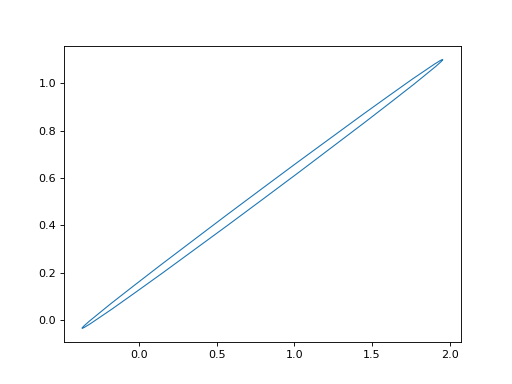
- bluebell.plot.cov_ellipse(mu, C, ax=None, **kwargs)[source]
Plot an ellipse at point
mugiven its covariance matrixcov.- Parameters:
mu (array (2,)) – Center of the ellipse
C (array (2,2)) – The covariance matrix for the point
ax (matplotlib.Axes, optional) – The axis to overplot on
**kwargs (dict) – These keywords are passed to matplotlib.patches.Ellipse
- Returns:
ellipse
- Return type:
matplotlib Ellipse object
Example
import matplotlib.pyplot as pl
import bluebell.plot as bbplot

A = np.random.rand(2,2)
C = A.T.dot(A)
mu = np.random.rand(2)
std = np.sqrt(np.diag(C))

bbplot.cov_ellipse(mu, C, ec='C0', fc='none')
pl.axis((mu + np.array([[-1.1],[1.1]])*std).T.flatten())
(
Source code,png,hires.png,pdf)
- bluebell.plot.chi2_corner(x, chi2, vmin=None, vmax=None, names=None, cmap='inferno', scale='sqrt')[source]
Create a corner plot showing the 2-d projections of the sample x in with each point coloured by its relative value of chi2, as well as a top row showing 1-d plots of chi2 for each dimension.
- Parameters:
x (2-d NumPy array of shape (N, D)) – Points at which function has been evaluated.
chi2 (1-d NumPy array of shape (N,)) – Values of chi-squared for the points in
x.
- Returns:
fig (matplotlib figure)
ax (2-d array of shape (D, D) of matplotlib.axes) – Array of the matplotlib axes containing the individual scatter plots.
Example
import matplotlib.pyplot as pl
import bluebell as bb
import bluebell.plot as bbplot

D = 3
C = np.eye(D)
mu = np.zeros(D)
std = np.sqrt(np.diag(C))

x = np.random.uniform(low=mu-std, high=mu+std, size=(100,D))
x[0] = mu
chi2 = np.sum(x.dot(np.linalg.inv(C))*x, axis=1)

fig, ax = bbplot.chi2_corner(x, chi2)
(
Source code,png,hires.png,pdf)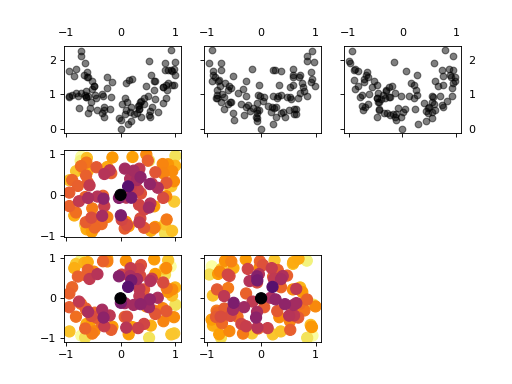